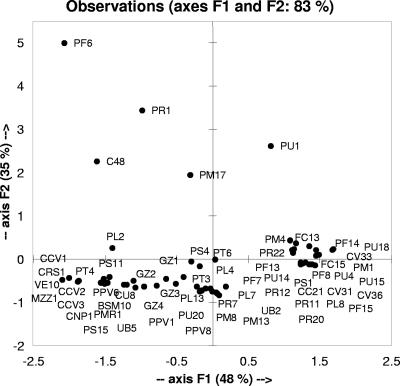
FIG. 1.
Score plot of the first and second principal components after principal component analysis based on the concentrations of GABA, glutamic acid, and total FAAs of RSM started with lactic acid bacteria. Each fermented milk is indicated by the code of the lactic acid bacterium used for fermentation. The values are the averages of three batches of each milk fermentation.

