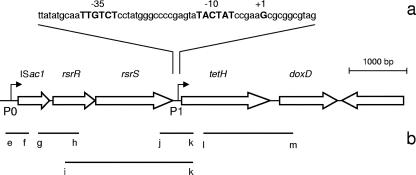
FIG. 1.
(a) A. caldus tetH gene cluster with the expanded portion describing the P1 promoter region showing the −10 and −35 sequences and transcription start site (all in bold caps). (b) Positive transcripts detected by RT-PCR represented by lines under the corresponding genes (to scale; see Table 1 for primers). The second transposase was not labeled as it is coded on the opposite strand.

