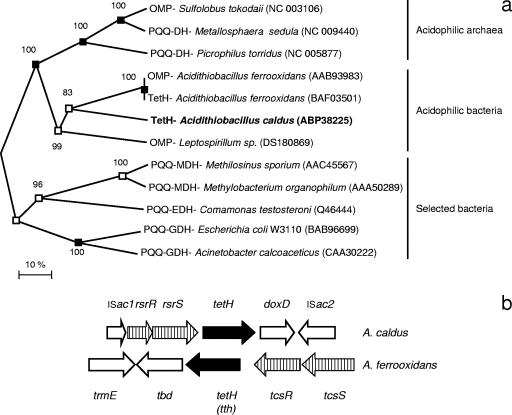
FIG. 2.
(a) Unrooted neighbor joining tree of the A. caldus tetH (in bold) alignment with closest relatives from the NCBI database containing a PQQ binding domain and selected neutrophilic dehydrogenases also containing a PQQ binding domain. Phylogenetic analysis was carried out by the minimum evolution, distance neighbor joining, and maximum parsimony methods in MEGA; the nodes supported by all three trees (filled boxes) and by two trees (open boxes) have been marked, and the values by the nodes are bootstrap values of 1,000 runs. Accession numbers are given in parentheses. The scale bar represents 10% sequence similarity. (b) Gene block comparison of the A. caldus and A. ferrooxidans gene clusters. Vertical lines represent the two-component regulation system, and solid black denotes the tetrathionate hydrolase gene (termed tth in A. ferrooxidans).

