
FIG. 3.
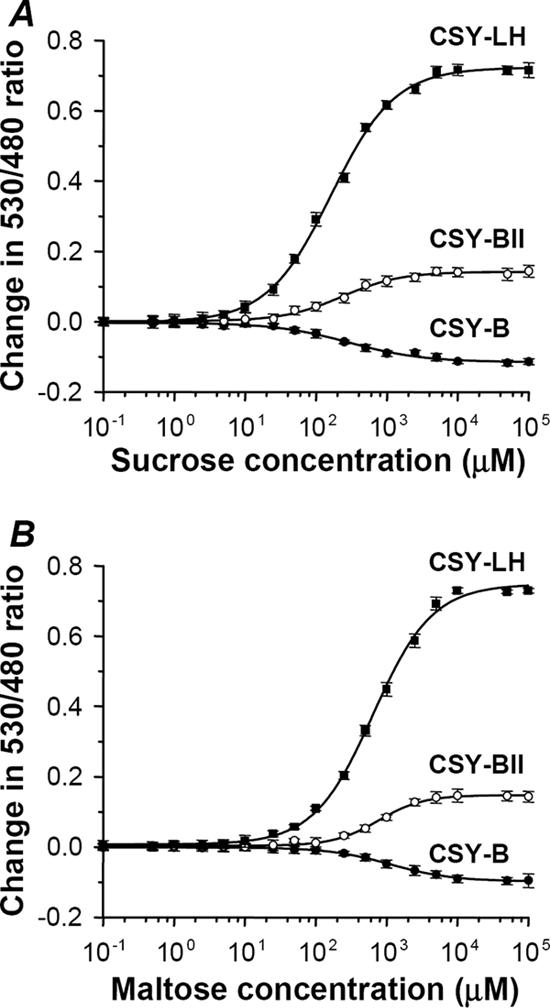
Titration curves for purified sucrose/maltose sensors, redesigned from maltose sensors. Ratio changes with sucrose (A) and with maltose (B). Symbols represent sensor proteins with different linker moieties. The solid curve represents the least-squares fit of ratio change to the concentration of ligand.