
FIG. 4.
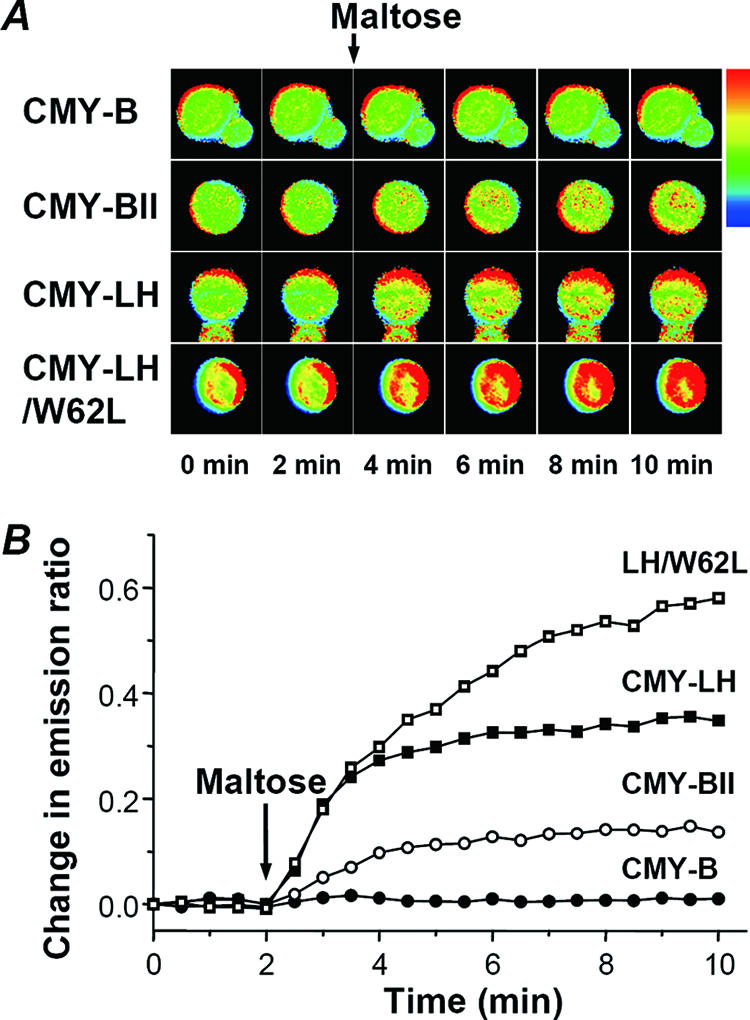
Comparative measurements of maltose uptake in living yeast cells. (A) Ratio imaging of maltose uptake in yeast cells. The cyan and yellow images were merged pixel by pixel and analyzed based on the ratio method of the FRET analysis protocol using CellP software (Olympus Co., Hamburg, Germany). After the cyan and yellow images were merged, pseudocolored images were produced using option Rainbow3 to demonstrate the dynamic changes of the maltose concentration in the living yeast, where red indicates a high ratio and green indicates a low ratio. Maltose was added after 2 min, as indicated by the arrow on top. (B) Quantification of resulting ratio images. To quantify the ratio images obtained, 5 to 11 cells were selected as ROIs, and the cyan and yellow fluorescent intensities were analyzed using CellP software.