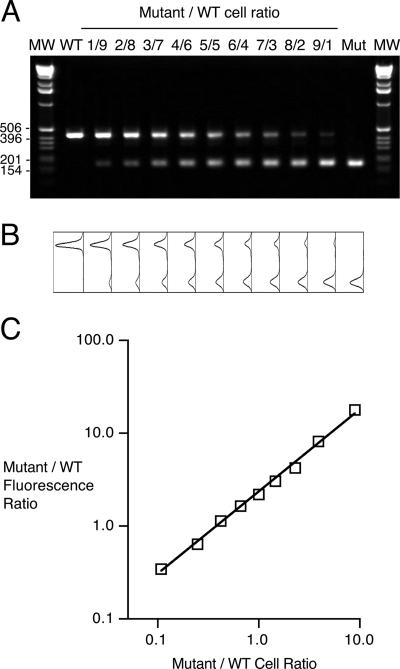
FIG. 3.
Relationship between ΔfauA2/fauA+ PCR product DNA molar ratios and cell ratios in mixed bacterial suspensions. (A) Ethidium bromide-stained gel showing PCR products generated by coamplification of ΔfauA2 and fauA+ DNA copies in mixed bacterial suspensions with various PM11/UT25Sm1 cell ratios (1/9 [1 volume of mutant suspension combined with 9 volumes of wild-type suspension], 2/8 [2 volumes of mutant suspension combined with 8 volumes of wild-type suspension], etc.). Lanes labeled WT and Mut show PCR products generated from pure suspensions of UT25Sm1 and PM11 alone, respectively. MW, size markers with indicated sizes in bp. (B) Plots showing raw fluorescence peaks associated with the corresponding gel lanes in A. (C) Mutant-to-wild-type (WT) fluorescence ratio as a function of the mutant-to-wild-type cell ratio in mixed strain suspensions. Fluorescence intensity peak areas were normalized for molar differences in the fluorescent dye-binding capacities of the wild-type- and mutant-specific products as described in Materials and Methods. The line represents the best-fit line (r = 0.999).

