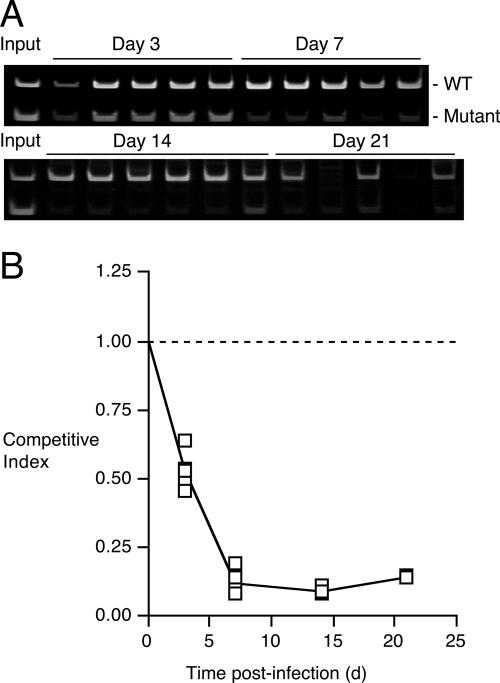
FIG. 8.
PCR product yields and CI values based on cPCR analysis of mouse tissue homogenates in mixed-infection competition studies. (A) Ethidium bromide-stained gel images showing relative yields of 430-bp fauA+- and 175-bp ΔfauA2-specific PCR products coamplified from DNA extracted from infected mouse respiratory tract tissues. Each gel lane represents a single infected mouse. Products generated using the input strain mixture are also shown. (B) CI values based on ΔfauA2/fauA+ fluorescence peak area ratios determined by cPCR. Relative DNA copy number yields of fauA+- and ΔfauA2-specific PCR products were determined by fluorescence image analysis of the stained gels shown in A. Each symbol represents the CI calculated for a single mouse at a given time point, and the line represents the mean CI value. The dashed line (y value of 1.00) corresponds to the hypothesized CI value if there was no difference in fitness between the strains in this mouse model of respiratory infection.

