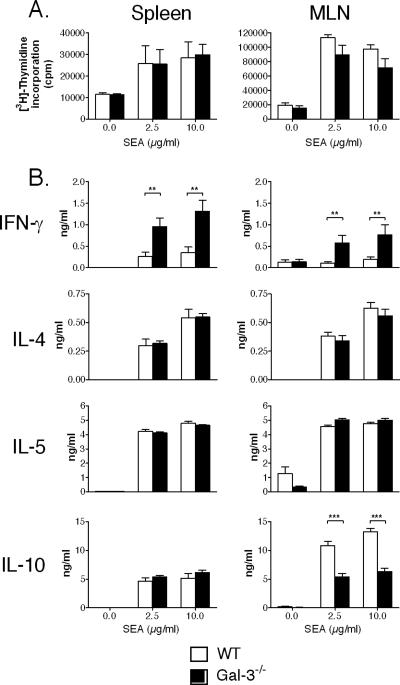
FIG. 1.
Analysis of the cellular response in S. mansoni-infected WT and Gal-3−/− mice. Data reflect the proliferative response (A) and cytokine production (B) of spleen or MLN cells recovered from S. mansoni-infected WT or Gal-3−/− mice at 7 weeks p.i. Cells were restimulated with increasing doses of SEA (shown are 2.5 and 10 μg/ml) or were left unstimulated. Cytokine production and proliferation were measured after 3 days of culture. Results represent the means of triplicate cultures ± SDs (6 to 8 mice per group). One representative experiment out of two is shown. **, P < 0.01; ***, P < 0.005.

