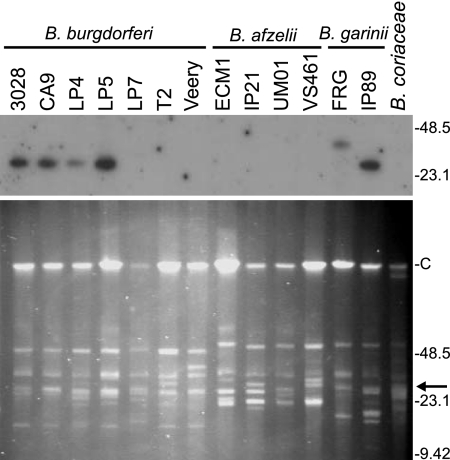
FIG. 1.
PFGE and cspZ hybridization analyses of diverse Lyme disease spirochete isolates. All methods were as described in the text. The plasmid content of each isolate was visually assessed through ethidium bromide staining of the fractionated DNA (bottom). The DNA was then transferred to a membrane and hybridized with a radiolabeled cspZ amplicon derived from B. burgdorferi B31MI (top). Molecular size markers (in kilobases) are indicated in each panel. The letter “C” indicates the migration position of the 960-kb linear plasmid. The arrow in the lower panel indicates the approximate migration position of the hybridizing plasmid.

