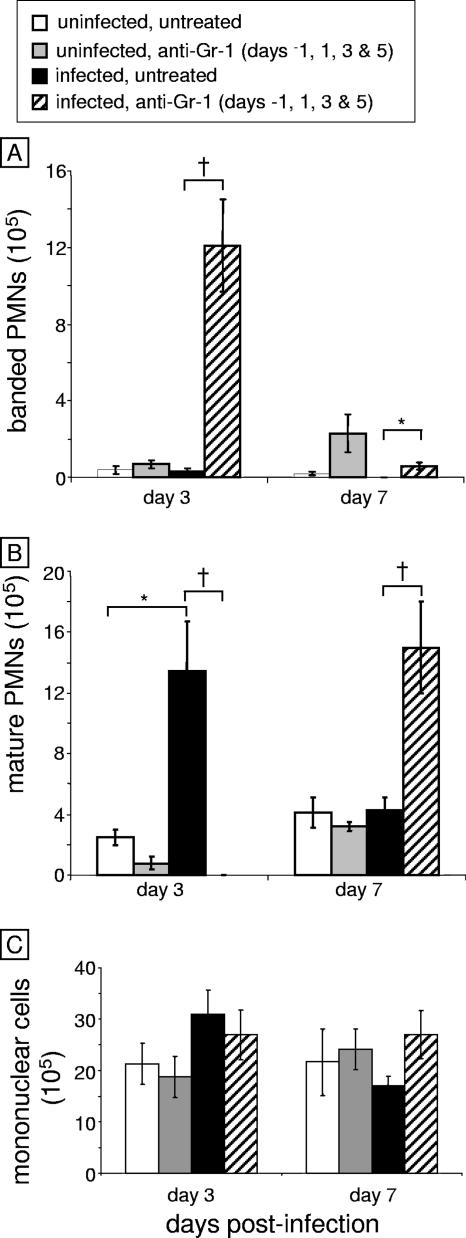
FIG. 4.
Differential analysis of nasal leukocyte recruitment. Following leukocyte isolation from nasal cavity digests, cytospin slides were made and stained with Wright-Giemsa stain to visualize cell populations. (A) Mature neutrophil cell counts. (B) Immature (banded) neutrophil cell counts. (C) Mononuclear cell counts. An asterisk indicates a P value of <0.05 and a dagger indicates a P value of <0.01 as determined by Student's t test (n = 6 mice per group). PMNs, polymorphonuclear leukocytes.

