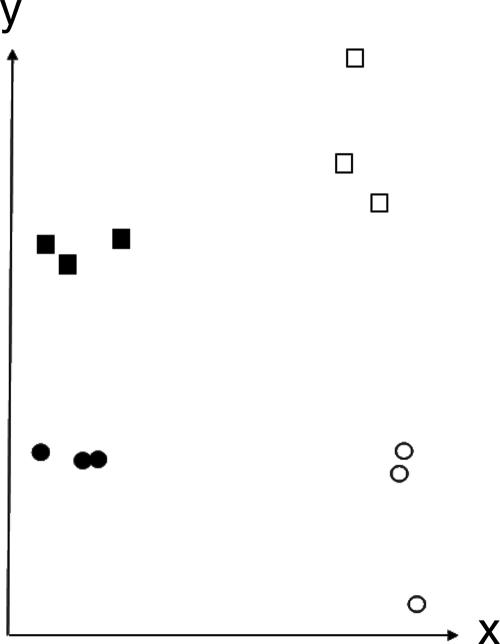
FIG. 1.
Plot of SVD of the 12 tissue arrays. The x axis represents the projections of 12 samples onto the eigenvector that depicts the major variation between infected and uninfected samples. The arrow on the x axis points toward higher expression levels in infected samples than in uninfected samples. The y axis represents the projections of 12 samples onto the other eigenvector, which depicts the major variation between PP and RR subjects. The arrow on the y axis points toward higher expression levels in PP samples than in RR samples. Thus, the analysis separates the arrays into four groups that reflect the biology of the PP and RR phenotypes and infected and uninfected sites. Closed circles, RRU; open circles, RRI; closed squares, PPU; open squares, PPI.

