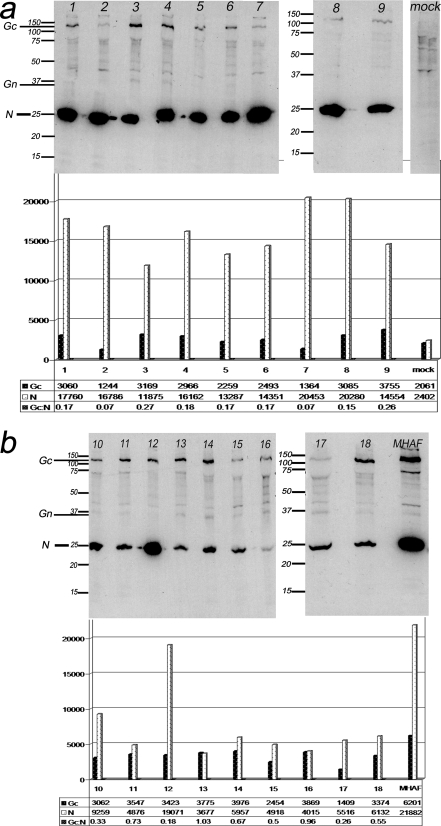
FIG. 5.
Immunoprecipitation of proteins from INKV-infected Vero E6 cells with (a) human sera (lanes 1 to 9), representing acute INKV infection (IgM positive and IgG positive) and an INKV IgG-negative serum (mock). (b) Human sera (lanes 10 to 18) from patients with long-standing INKV immunity (IgM negative and IgG positive) and a MHAF. Intensity of the N and Gc proteins bands are trace quantity values (intensity/millimeter). Statistical analysis for the Gc/N ratio between acute and long-standing immunity (Student's t test for independent samples) (the mean ± SD for long-standing-immunity cases was 0.6 ± 0.3, and that for acute cases was 0.3 ± 0.2) showed that the difference observed between the two groups was significant. P = 0.02; t = 2.6; df = 15.2 (equal variances not assumed).

