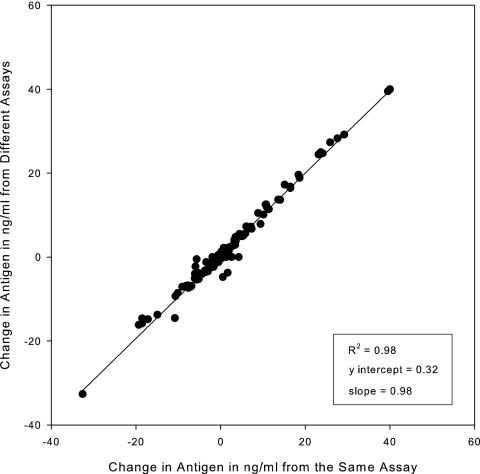
FIG. 3.
Interassay agreement of changes in nanograms/milliliter in histoplasmosis cases with paired current and prior specimens, comparing results determined in the same assay (same day) with those determined in different assays (different days). Data below the 0 value represent pairs in which the concentration decreased in the current specimen compared to that of the prior specimen, and data above 0 represent pairs in which the concentration increases in the current specimen compared to that of the prior specimen.

