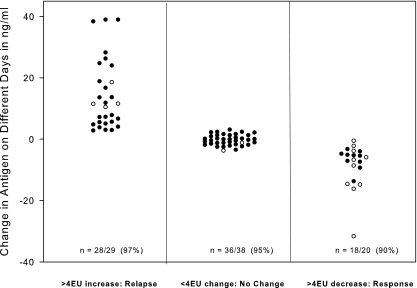
FIG. 4.
Changes in antigen concentration between a current and prior specimen first categorized according to the change in antigen EU in the same assay and then plotted with the change in antigen concentration calculated quantitatively as nanograms/milliliter from separate days' assays. The number/total (percent) shown on the column designates agreement between the category of change in nanograms/milliliter as determined from different days' assays with change in antigen EU determined from the same assay. For the determination of agreement, a significant change in nanograms/milliliter was defined as >3 ng/ml when the concentration in the prior specimen was <20 ng/ml (designated by closed circles on the graph) and >15% when the concentration in the prior specimen was ≥20 ng/ml (open circles).

