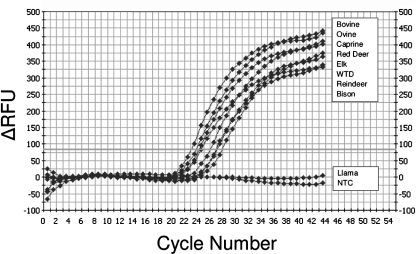
FIG. 1.
Typical IFN-γ real-time RT-PCR amplification curves from multiple target species. Real-time PCR was performed on cDNA obtained from mitogen-stimulated PBMCs of the following species: bovine (Bos taurus), ovine (Ovis aries), caprine (Capra hircus), bison (Bison bison), red deer (Cervus elaphus elaphus), elk (Cervus elaphus manitobensis), white-tailed deer (WTD) (Odocoileus virginianus), reindeer (Rangifer tarandus), and llama (Llama glama). The amplification curves showed positive reactions for all tested animals with the exception of llamas. The y axis indicates the absolute emission intensity (delta RFU indicates relative fluorescence units subtracted by the background fluorescence signal); the x axis shows the number of PCR cycles. NTC, no template control.

