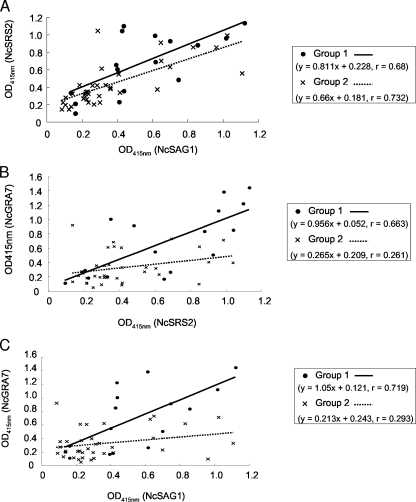
FIG. 2.
Comparison of the correlation between the OD415 values from ELISA with two antigens. (A) Correlation between the OD415 values from ELISA with NcSAG1 and NcSRS2. (B) Correlation between the OD415 values from ELISA with NcSRS2 and NcGRA7. (C) Correlation between the OD415 nm values from ELISA with NcSAG1 and NcGRA7. Group 1 includes serum samples from aborting cows. Group 2 includes samples from nonaborting cows. Pearson's correlation coefficient analysis and simple regression were used to assess the relationship between the OD415 values from ELISA with two antigens. The difference in the correlation coefficients of the regression lines obtained from two groups was determined by testing the t value.

