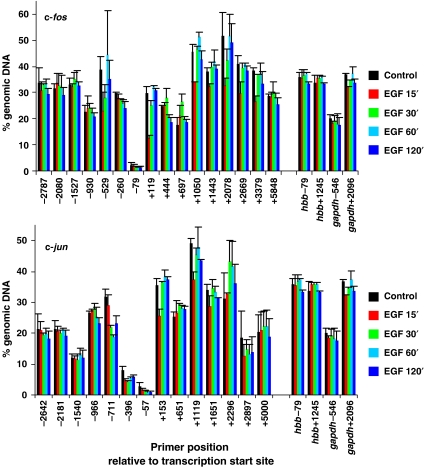
Figure 2.
MNase sensitivity across c-fos and c-jun in quiescent and EGF-stimulated mouse cells. Quiescent cells were unstimulated (control) or stimulated with EGF (50 ng/ml) for 15, 30, 60 or 120 min and formaldehyde crosslinked mononucleosomes were prepared. Equivalent amounts of DNA were isolated from each sample (the DNA is from the same (input) chromatin samples used for the ChIP assays shown in Figure 1 and Supplementary Figure S1) and specific sequences were quantified by real-time PCR. MNase sensitivity is expressed as % of amplifiable DNA sequence in the chromatin sample relative to that in an equivalent amount of intact genomic DNA (more digestion within a region is reflected by fewer intact template molecules that are amplifiable by PCR). Average values from two independent experiments are plotted with s.d. Primers spanning two regions of the hbb and gapdh genes were also analysed and the data are included on both graphs for comparison (c-fos upper panel, c-jun lower panel).

