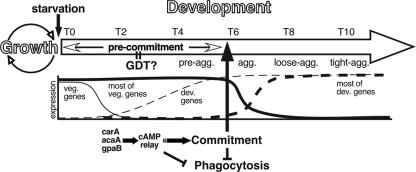
FIG. 6.
The time course of commitment. The wide outlined arrow represents the developmental time from 0 to 10 h (T0 to T10) after starvation, the dashed lines represent examples of developmental gene expression patterns, and the solid lines represent examples of vegetative gene expression. Abbreviations: pre-agg., preaggregation; agg., aggregation; loose-agg., loose aggregate; tight-agg., tight aggregate; veg., vegetative; dev., developmental. See text for details.

