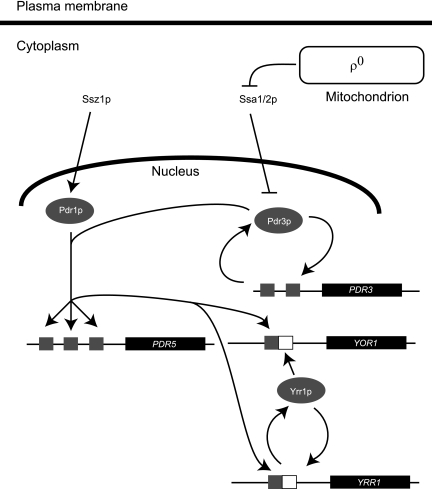
FIG. 1.
Multidrug resistance pathway in Saccharomyces cerevisiae. A general scheme describing key genetic interactions regulating pleiotropic drug resistance is shown. Standard arrows indicate positive interactions, while the blunt arrows denote negative regulation. The small gray boxes represent Pdr1p/Pdr3p response elements (PDREs), and the white boxes indicate Yrr1p response elements.

