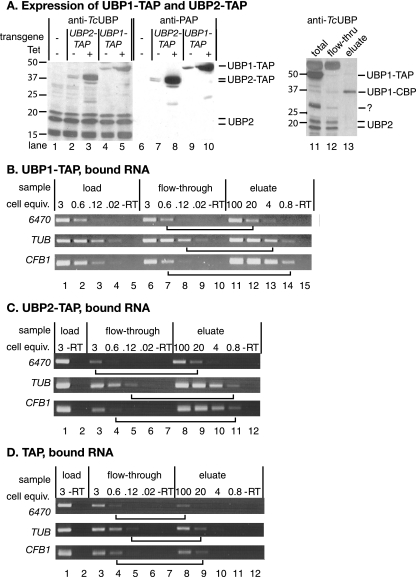
FIG. 7.
Interaction of TbUBP1 and TbUBP2 with RNA. (A) Expression of C-terminally TAP-tagged TbUBP1 and TbUBP2 in bloodstream forms. Labeling is as in Fig. 3. The IgG binding domain was detected using HRP-IgG (lanes 6 to 10), and then the blot was stripped and all UBPs were detected with the anti-UBP1 antibody (lanes 1 to 5). Lanes 11 to 13 show a Western blot (using anti-TcUBP1) of a typical first purification step (bloodstream forms). Total cell extract is in lane 11, the flowthrough from the IgG column is in lane 12, and the TEV eluate from the IgG column is in lane 13. Identical proportions of the material (equivalent cell numbers) were loaded in all three lanes. Detection is with anti-TcUBP1; using these extracts, there was cross-reaction with a thick band at 50 kDa. Note that neither TbUBP2 nor untagged TbUBP1 is found in the final eluate. The band around 30 kDa which was retained on the IgG column could be untagged TbUBP1, but this is unlikely since untagged TbUBP1 does not react with the antibody in bloodstream forms. Perhaps it was a fragment of the tagged protein. (B) Extracts from TbUBP1-TAP-expressing bloodstream forms were passed over an IgG column. The column was washed, and then bound material was eluted with TEV protease. RNA was prepared and reverse transcribed using random primers. Various dilutions of the cDNA were then subjected to PCR (30 cycles) by using gene-specific primers, and the products were detected by agarose gel electrophoresis and ethidium bromide staining. The numbers of cell equivalents used for each PCR are shown in millions above the lanes: for example, lane 1 shows the RT-PCR product from 3 × 10⁶ cells, and lane 11 shows the RT-PCR product from 108 cells. “-RT” shows the reaction from the maximum relative number of cell equivalents, without reverse transcriptase. To assess the degree of binding, we compared signals from the eluate with signals from the flowthrough fraction. Examples of lanes with equivalent signals are joined by horizontal lines. The results of three replicate experiments were quantitated by scanning densitometry, and in each case about five times more CFB1 mRNA than control mRNAs was bound. (C) As for panel B, using cells expressing TbUBP2-TAP. (D) Same as for panel B, using cells expressing the TAP tag alone.

