FIG. 2.
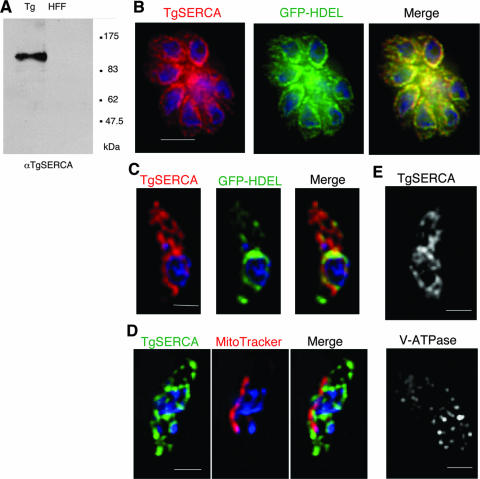
Localization of TgSERCA in T. gondii. (A) Western blot with anti-TgSERCA antibody against T. gondii lysate (Tg) revealed a single band of 120 kDa, while HFF cell lysate (HFF) was negative. (B) Immunofluorescence staining of intracellular T. gondii. Intracellular parasites expressing GFP-HDEL were stained with anti-TgSERCA, followed by Alexa-594-conjugated goat anti-mouse IgG (red). The middle panel shows the signal of GFP-HDEL (green), with a merged image shown at the right. Nuclei were stained with DAPI (blue). Bar, 5 μm. (C) Localization of TgSERCA and GFP-HDEL in extracellular parasites. Panels: left, anti-TgSERCA (red, stained as in panel B); middle, GFP-HDEL (green); right, merged image. Nuclei were stained with DAPI (blue). Bar, 2 μm. (D) Localization of TgSERCA and mitochondrion in extracellular parasites. Panels: left, stained with mouse anti-TgSERCA followed by Alexa-488-conjugated goat anti-mouse IgG (green); middle, MitoTracker (red), right, merged image. Nuclei were stained with DAPI (blue). Bar, 2 μm. (E) Localization of TgSERCA (upper) and acidocalcisomes (lower) in separate extracellular parasites. The upper panel was stained with mouse anti-TgSERCA, followed by goat anti-mouse IgG; the lower panel was stained with anti-V-ATPase, followed by goat anti-mouse IgG. Bar, 2 μm. Wide field images were acquired and deconvolved as described in Materials and Methods. A single mid-Z plane is shown for each example.

