FIG. 4.
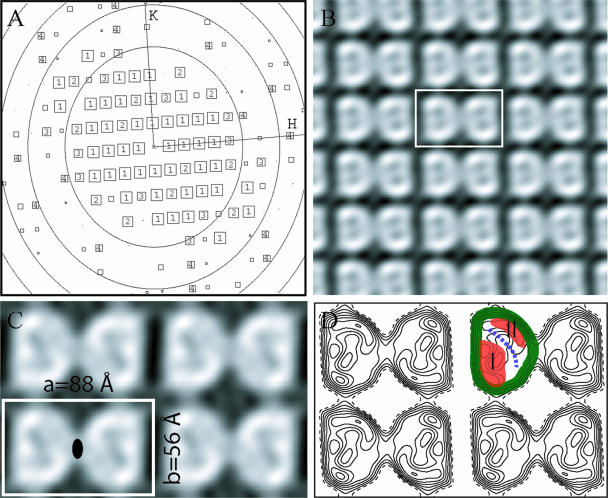
HMW1B is a dimer when reconstituted in lipid bilayers. (A) A representation of the quality of amplitudes of structure factors derived from the Fourier transform of an image after correction of lattice distortions. The number in each square is the intensity quotient (IQ), i.e., the strength of the spot (13), which ranges between 1 (strongest) and 9 (weakest). The reflections with IQ more than 8 are not shown. The concentric oval rings represent the zero values of the contrast transfer function. The edge of the plot corresponds to a resolution of 8 Å. H and K are reciprocal lattice indices. (B) A gray scale plot of the projection structure of HMW1B calculated from structure factors obtained from one 2D crystal image. The unit cell is marked by a white rectangle. No symmetry was applied, but the twofold symmetry relating the two monomers in a unit cell is clear. (C) The projection structure of HMW1B with p2 symmetry enforced. The cell dimensions are labeled. The filled oval indicates the twofold symmetry axis. (D) Contour plot of the projection structure shown in panel C. The highest density band, corresponding to the projection of the wall of the β-barrel, is colored green. Two lower density regions are orange and are labeled I and II, limiting the low-density pore region, which is indicated by a blue dashed line, to ∼10 Å.

