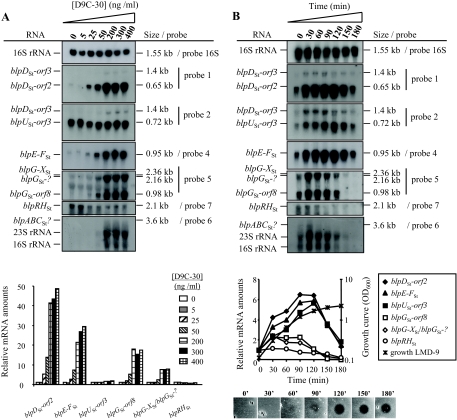
FIG. 5.
Transcriptional regulation of the blpSt locus. (A) Analysis of the BlpCSt dose-response on transcription of blpSt genes. The amount of D9C-30 added to LMD-9 cultures (OD600 of 0.1) ranged from 0 to 400 ng/ml. After a 2-h induction, total RNA was extracted, and Northern blotting experiments were performed. Total RNAs were extracted from each sample, and equal amounts were separated on formaldehyde gels and hybridized with radiolabeled probes (Fig. 4B). The same membranes were rehybridized with the different probes. The relative mRNA amounts of the various blpSt transcripts are shown below the blots and were calculated at each D9C-30 concentration with respect to the RNA amount in noninduced cultures (0 ng/ml D9C-30). The radioactivity levels corresponding to blpG-XSt and blpGSt-? transcripts were added together. (B) Time course expression of the various blpSt transcripts upon D9C-30 induction and correlation with bacteriocin production during growth. Culture samples were collected before the addition of 400 ng/ml D9C-30 in the mid-log growing culture (OD600 of 0.1; time zero), and every 30 min for 180 min after the addition. Northern blotting experiments were performed as for panel A. The relative mRNA amounts (shown below the blots) were calculated from the radioactivity measured in the transcript bands at each time point with respect to that found before the addition of the inducer peptide (time zero). The radioactivity levels from blpG-XSt and blpGSt-? transcripts were added together. The induction of bacteriocin production is shown at the bottom of panel B. Five microliters of cell-free supernatants from the same samples used for the RNA extraction was spotted on a lawn of the indicator strain CNRZ1066. For experiments presented in panels A and B, one representative result of two individual experiments performed with different RNAs is shown.

