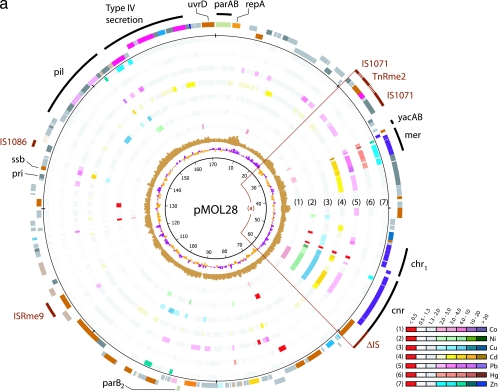
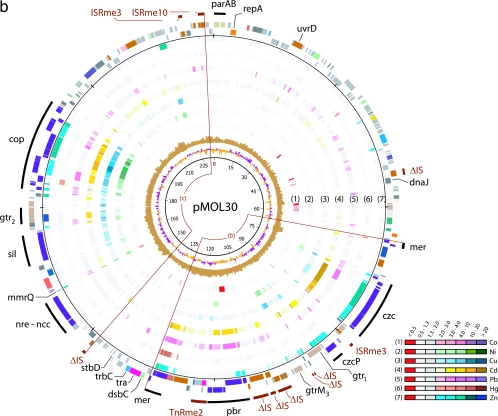
FIG. 1.
Expression analysis of pMOL28 (a) and pMOL30 (b). Plasmids pMOL28 and pMOL30 display gene expression under various metal conditions. The sequences of both plasmids start at the ATG codon of the parA gene that is oriented clockwise. The innermost circle is a GC deviation plot and represents the mean centered G+C content (purple, above mean; orange, below mean) using a window size of 500 nucleotides and a 250-nucleotide window overlap. The next circle (light brown) is a GC skew plot in which the (G-C)/(G+C) ratios are shown in sliding windows of 500 nucleotides with a window overlap of 250 nucleotides. The next seven circles (circles 1 through 7) correspond to the results of gene expression for the seven different metals listed in the color-coded diagram. The common color red indicates a negative expression ratio (i.e., down-regulation), while the common colors gray and white indicate expression ratios (range, 0.5 to 2.0) that are considered to be within the background threshold. Up-regulated genes (expression ratio, >2.0) appear in different shades from light to dark corresponding to the degree of increased expression. The two circles on the outside display the genes in functional categories according to the COG color scheme (from NCBI, Bethesda, MD; http://www.ncbi.nlm.nih.gov/COG/grace/fiew.cgi), with genes in the outer circle oriented clockwise and genes in the inner circle oriented counterclockwise. Special features are shown as bars that are either black (for metal resistance genes) or dark brown (for IS elements). The circular positions are indicated at intervals of 10,000 bp. The arcs of circle displayed are (a) the cnr-chr-mer island, (b) the mer-pbr-czc island, and (c) the copper island.


