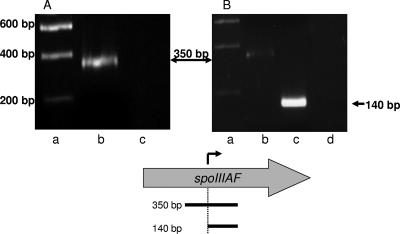
FIG. 6.
RT-PCR analysis of transcripts in the P2spoIIIA region. RT-PCR was performed using two different forward primers in order to compare the amounts of transcript generated by P1spoIIIA alone and by P1spoIIIA and P2spoIIIA together. Each panel shows the ethidium bromide-stained DNA after electrophoresis in agarose. Lane a contained molecular weight standards in both panels. Lane b in both panels contained the 350-bp RT-PCR product of the transcript from P1spoIIIA, whereas lane c in panel B contained the 140-bp RT-PCR product from transcripts originating from both P1spoIIIA and P2spoIIIA. Lane c in panel A and lane d in panel B contained the products from control reactions in which no reverse transcriptase was added. Below panels A and B is a map of spoIIIAF. The arrow above spoIIIAF and the dotted vertical line indicate the P2spoIIIA start point of transcription. The horizontal lines below spoIIIAF indicate the 350- and 140-bp cDNA amplified from the P1spoIIIA and P2spoIIIA transcripts, respectively.

