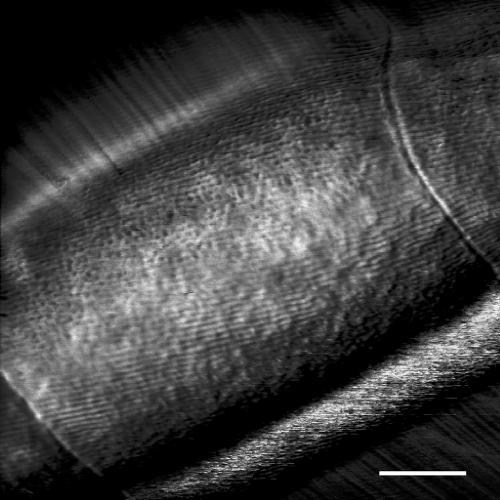
FIG. 6.
AFM image of Oscillatoria sp. strain A2. The scan was performed under liquid on a sample immobilized in dental wax. Cell septa can be seen at the bottom left and top right of the micrograph. The fibrillar array shows the same highly regular arrangement seen in FEGSEM images (Fig. 1); the partial disruption of the fibrils apparent in the AFM scans of dry samples (Fig. 2 and 3) is not seen in this fully hydrated sample. Scale bar, 500 nm.

