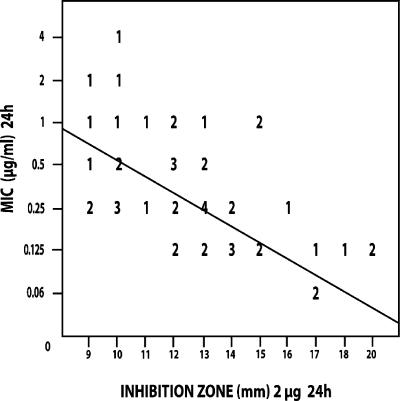
FIG. 3.
Regression analysis for CAS susceptibility values of non-Candida albicans isolates (n = 50) correlating the 24-h zones of inhibition (mm) determined with Mueller-Hinton agar plates with the 24-h MICs determined by the CLSI broth dilution method (μg/ml). The line of best fit is shown, and the regression statistics gave a Pearson's r value of −0.333. The numbers in the figure are the numbers of strains that correlate with each value.

