
FIG. 8.
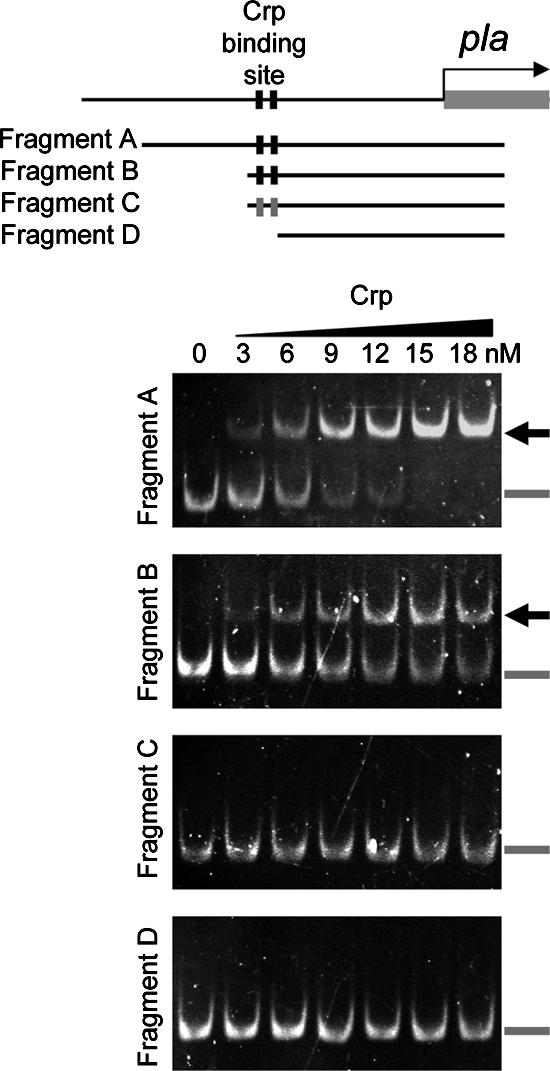
Crp complexes with DNA from the pla promoter region assessed by EMSA. The schematic diagram shows the location of the Crp binding site centered at nucleotide −60.5 (black boxes) relative to the pla open reading frame. Below this diagram the fragments of DNA evaluated for Crp-DNA complex formation are shown. Fragment A, nucleotides −169 to 133; fragment B, nucleotides −77 to 133; fragment C, nucleotides −77 to 133 with two nucleotide changes that alter each Crp binding half-site (gray boxes); fragment D, nucleotides −56 to 133 without the Crp binding site. Images for each EMSA are also shown; the samples used contained increasing amounts of purified Crp, as indicated. The location of Crp-DNA complexes is indicated by the arrows. The position of unbound DNA is indicated by the gray bars.