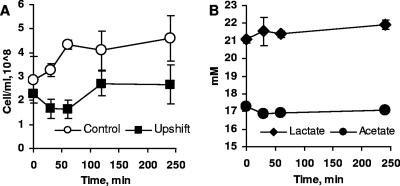
FIG. 1.
Growth and pH changes during pH upshift. (A) Cell numbers. (B) Lactate and acetate concentrations in the growth medium of the stressed culture. The data are means of triplicate cultures, and the observed variability was within 10%. The error bars indicate standard deviations of the means (n = 3).

