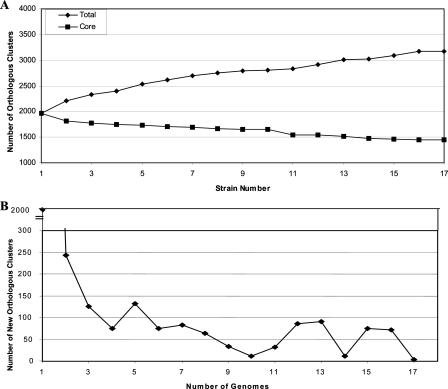
FIG. 4.
(A) Plot of the numbers of total and core observed orthologous clusters as a function of the number of strains sequenced. (B) Plot of the number of new observed orthologous clusters as a function of each genome. Numbers were calculated first for two strains and then iteratively for strains added one by one.

