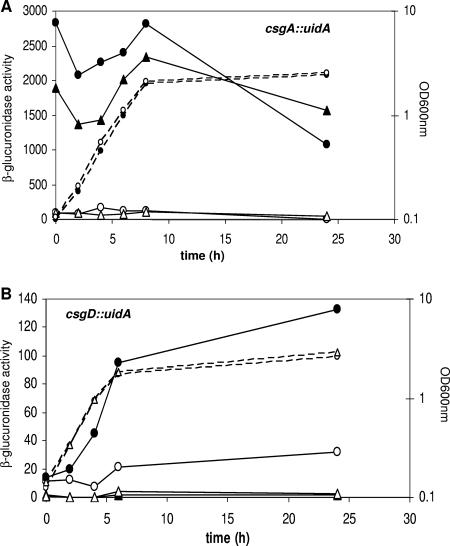
FIG. 4.
β-Glucuronidase activity measured from either csgA::uidA (A) or from csgD::uidA (B) chromosomal fusions. Cultures were grown in M9Glu/sup at 30°C. (A) Reporter gene expression from the csgB promoter was measured either in PHL856 (MG1655 csgA::uidA; circles) or in LG05 (MG1655 rpoS csgA::uidA, triangles) transformed either with pT7-7 (open symbols) or pT7CsgD (closed symbols). Dashed lines indicate growth curves of MG1655/pT7-7 (○) and MG1655/pT7CsgD (•) but are representative for all of the strains tested. (B) Reporter gene expression from the csgD promoter was measured either in PHL1088 (MG1655 csgD::uidA; circles) or in LG07 (MG1655 rpoS csgD::uidA, triangles) transformed either with pT7-7 (open symbols) or with pT7CsgD (closed symbols). Dashed lines indicate growth curves of MG1655/pT7-7 (○) and EB1.3/pT7-7 (•) but are representative for all of the strains tested. The data are an average of four independent experiments. Standard deviations were always lower than 15% and are not shown for clarity.

