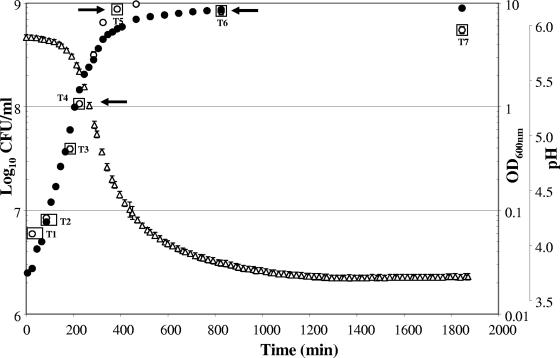
FIG. 1.
Growth curve of L. johnsonii NCC533 in MRS broth. Growth was monitored over time by measuring OD600 (filled circles), viable colony counts on MRS-cysteine agar (open circles), and drops in pH due to lactic acid production (triangles). Data points are arithmetic means with standard errors of the means (bars) from four independent experiments. The time points (T1 to T7) investigated for microarray expression analysis are boxed.

