FIG. 5.
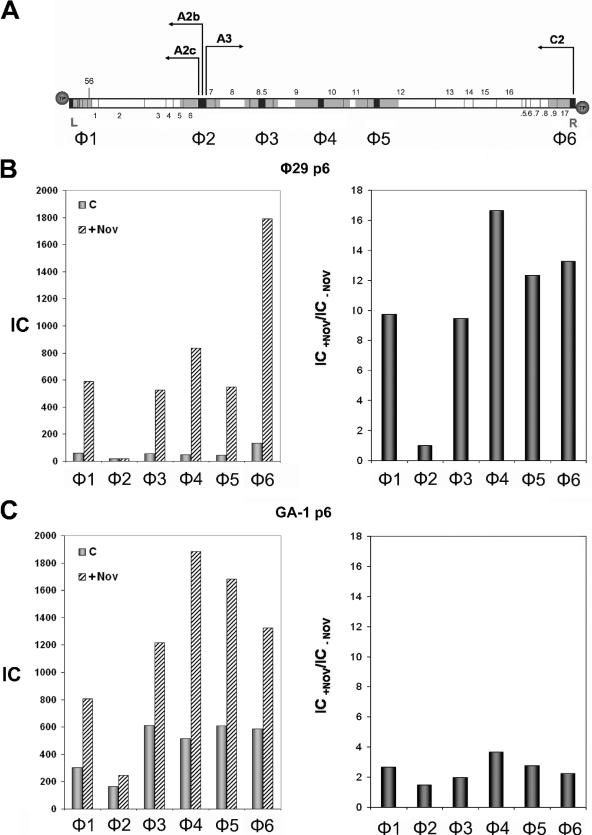
(A) Genetic and transcriptional map of phage φ29 linear DNA. The sequences selected for PCR amplification are shown in black and the regions analyzed for protein p6 binding, φ1-φ6, are shown in gray, as explained in Fig. 1A. The position of genes 1 to 17 and 56 is indicated. .5 to .9 stands for 16.5 to 16.9, respectively. Circles represent the terminal protein attached to the 5′ DNA ends. L and R indicate the left and right ends of the φ29 genome, respectively. The arrows point the direction of transcription: the early promoters C2, A2b, and A2c leftward and the late promoter A3 rightward. (B) φ29 protein p6 binding to φ29 DNA. B. subtilis 110NA cells producing φ29 protein p6 were infected with φ29 sus6(626) and, 20 min later, an aliquot (c) was cross-linked as described in Materials and Methods; another aliquot (+Nov) was treated with 34 μg of chloramphenicol/ml together with 500 μg of novobiocin/ml and cross-linked 40 min later. Protein p6 binding for each region is shown in the left panel. The IC values (c and +Nov) are as follows: φ1, 60.5 and 590; φ2, 18.5 and 18.6; φ3, 55.8 and 527.7; φ4, 50.1 and 834.4; φ5, 44.4 and 548.5; φ6, 134.9 and 1791; and P1, 205.9 and 767.5. Binding increase for each φ29 DNA region in the presence of novobiocin, expressed as IC+Nov/IC−Nov ratio, is shown in the right panel. (C) GA-1 protein p6 binding to φ29 DNA. B. subtilis 110NA cells producing GA-1 protein p6 were infected with φ29 sus6(626) and aliquots (c) and (+Nov) were obtained as described above. Protein p6 binding for each region is shown in the left panel. The IC values (c and +Nov) are the following: φ1, 303.7 and 805.9; φ2, 162.9 and 245.3; φ3, 613.4 and 1,216; φ4, 515.7 and 1,885.5; φ5, 607.3 and 1,681.8; φ6, 585.4 and 1,325; and P1, 586.3 and 975. The binding increase for each φ29 DNA region in the presence of novobiocin, expressed as the IC+Nov/IC−Nov ratio, is shown in the right panel.

