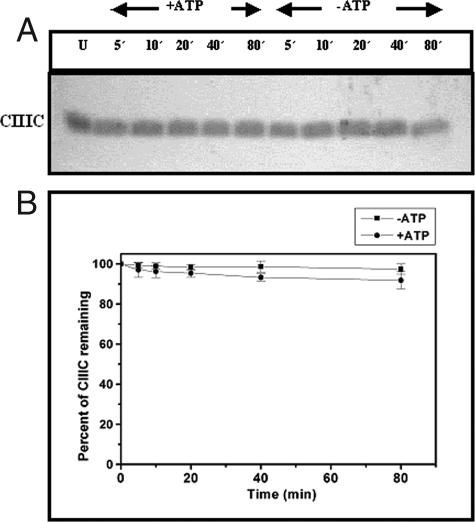
FIG. 6.
Proteolysis of CIIIC by HflB. (A) A 17.5% SDS-PAGE analysis showing the time course of digestion of CIIIC (2 nmol) by HflB (0.04 nmol) in the presence or absence of ATP (5 mM). Times of digestion in minutes are indicated at the top of each lane. An undigested CIIIC control is shown in lane U. (B) Amounts of CIIIC remaining after various times of digestion, obtained by densitometry of the gels.

