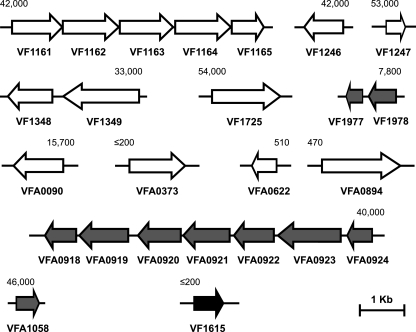
FIG. 1.
Genetic organization and transcription activation of 3OC6-HSL-controlled genes. White arrows represent 3OC6-HSL-activated genes, and a black arrow represents the 3OC6-HSL-repressed gene. Genes previously reported as 3OC6-HSL controlled are represented by gray arrows. The directions of the arrows indicate the DNA strand. The values for gene activation (relative units of GFP fluorescence per OD unit) are shown above the first gene in each operon and are from the E. coli expression studies described in the text. In all cases, basal levels of expression with LuxR and without 3OC6-HSL or without LuxR and with 3OC6-HSL were <200 fluorescence units. The values are means of three independent experiments, and the ranges were ±28% of the means.

