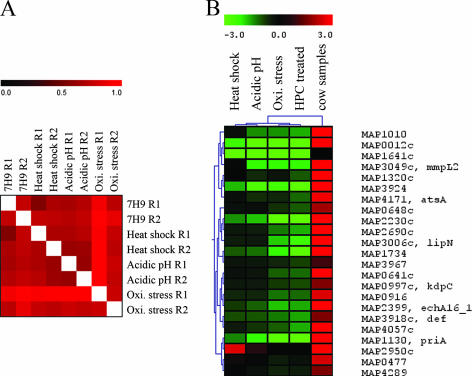
FIG. 2.
Hierarchical cluster analysis of the gene expression levels collected from M. avium subsp. paratuberculosis cultures exposed to variable stressors. (A) A heat map displaying the overall correlation among replicates of all examined stressors. (B) An example of cluster analysis showing genes activated only in the cow samples. Note the dendrogram displayed at the top of the image reflecting the overall relationship among examined samples. A color bar is presented at the top of each panel with a range from 0 to 1 (black to red) for panel A or from −3 to 3 (green to red) for panel B.

