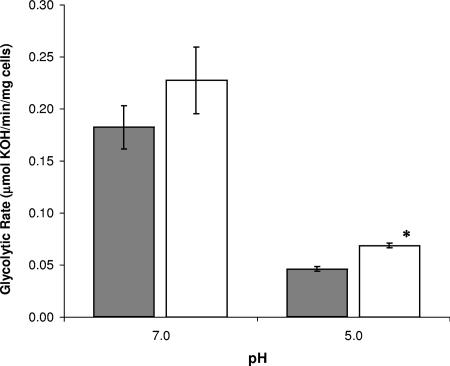
FIG. 4.
Glycolytic rates of S. mutans UA159 (gray bars) and LGLKO (white bars). Glycolytic rates were monitored by measuring the rate of the addition of 10 mM KOH to the cell suspension following the addition of 200 mM glucose at pH 7.0 and pH 5.0. The results are expressed as the means ± standard errors of three independent experiments. *, statistical significance compared with UA159 (pH 5.0; P < 0.05).

