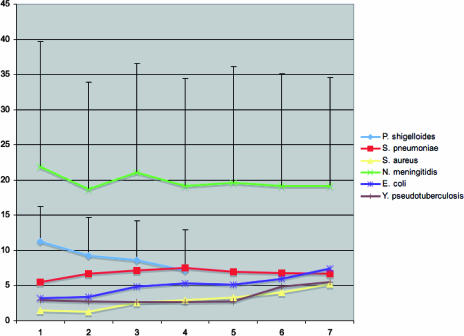
FIG. 4.
Relationship between allelic profile distance (x axis) and average number of nucleotide differences (y axis) in the distinct alleles. The error bars indicate the standard deviations for N. meningitidis and P. shigelloides. A positive trend was observed for S. aureus, E. coli, and Y. pseudotuberculosis, three species that are generally considered clonal. In contrast, P. shigelloides did not show a positive trend, similar to the recombining bacteria N. meningitidis and S. pneumoniae.

