FIG. 4.
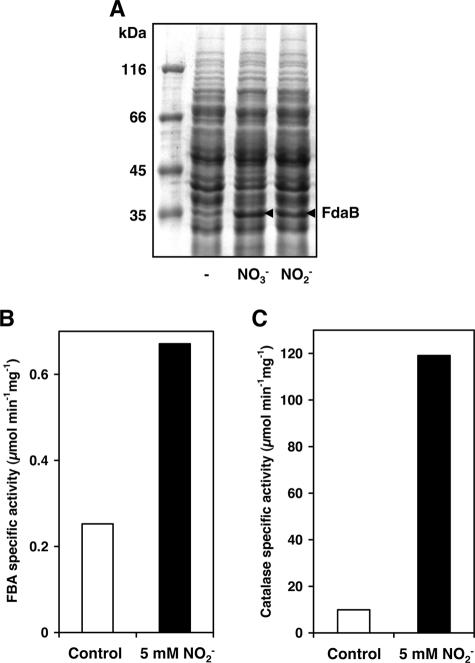
Phenotypic validation of microarray data by mapping physiological states of the cells. (A) Cells were grown in 6-well cell culture plates under biofilm conditions for 6 h. SDS-PAGE analysis of crude protein extracts followed by Coomassie blue staining showed induction of an approximately 35-kDa protein in response to 20 mM nitrate (NO3−) or 10 mM nitrite (NO2−) (arrowheads), which was identified by MS analysis as the class I fructose-bisphosphate aldolase FdaB. Crude protein extracts from cells grown under biofilm conditions for 6 h in the absence (Control) or presence of 5 mM nitrite (NO2−) were assayed for fructose-bisphosphate aldolase (FBA)- and catalase-specific activities (panels B and C, respectively). Data represent the means of two independent experiments.

