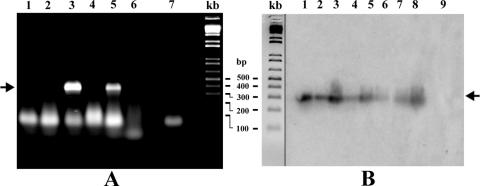
FIG. 2.
Examples of viroid detection in weed plants by RT-PCR. (A) RT-PCR analysis of PSTVd-infected weed species. Lanes: 1, G. parviflora; 2, S. media; 3, A. retroflexus; 4, A. sagittata; 5, V. agrestis; 6, E. cicutarium; 7, sample without RNA. No specific bands were detected in uninoculated plants. (B) RT-PCR, followed by molecular hybridization of HSVd samples (lanes 1 to 8) extracted from inoculated A. retroflexus 30 days postinfection. Position 9 represents a control sample from an uninoculated pant. In the center is shown a 1 KB Plus DNA Ladder (Life Technologies); the positions of PSTVd and HSVd-specific bands are indicated by the arrows.

