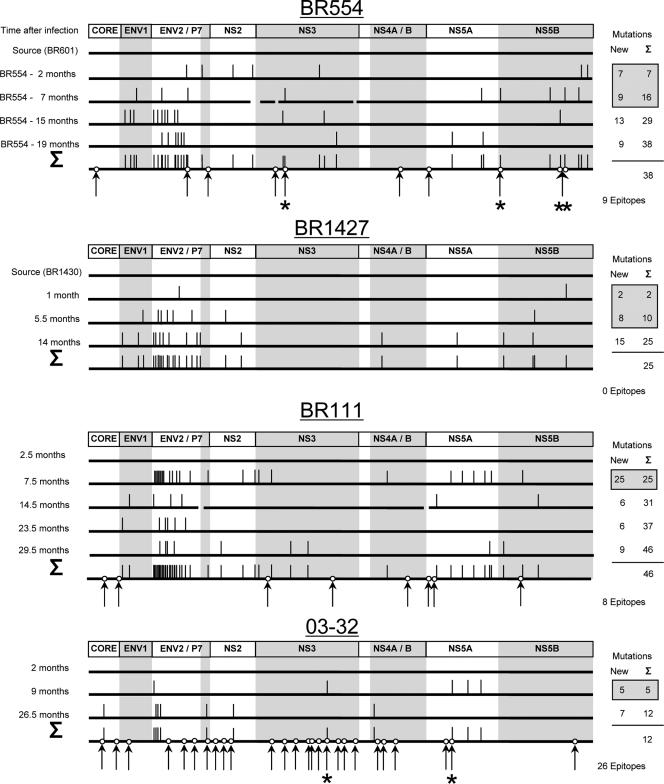
FIG. 3.
Sites of sequence variation and detected CD8+ T-cell responses. HCV viral genome sequences at multiple time points are illustrated as horizontal bars with time points shown on the left. Sequence changes are indicated as vertical dashes for each sequenced time point. The number of new mutations and the sum of mutations since the earliest available time point are listed on the right, with mutations considered to have happened during the early phase of the infection being framed in gray boxes. Detected CD8+ T-cell responses are depicted as circles and arrows. Asterisks mark targeted epitopes in which sequence variations were observed over time.

