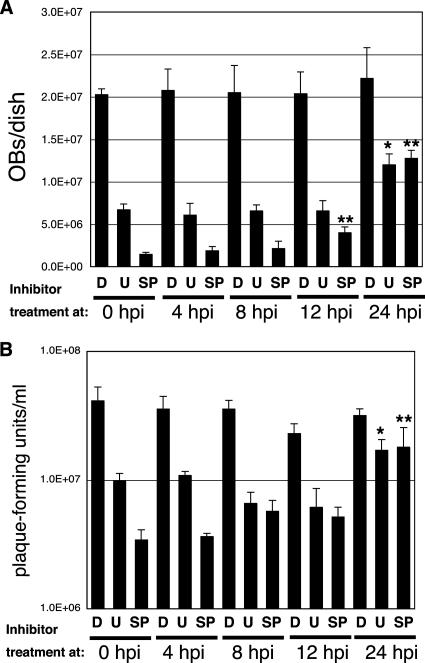
FIG. 3.
OB and BV production after application of inhibitors at different time points p.i. OB (A) or BV (B) production was assessed at 72 hpi in BmNPV-infected BmN cells after application of DMSO (D), U0126 (U) (10 μM), and SP600125 (SP) (10 μM) at different time points p.i. *, P < 0.05 versus cells treated with U0126 at 0 hpi; **, P < 0.05 versus cells treated with SP600125 at 0 hpi. Data show means ± SE of triplicates, and similar results were obtained in two independent experiments.

