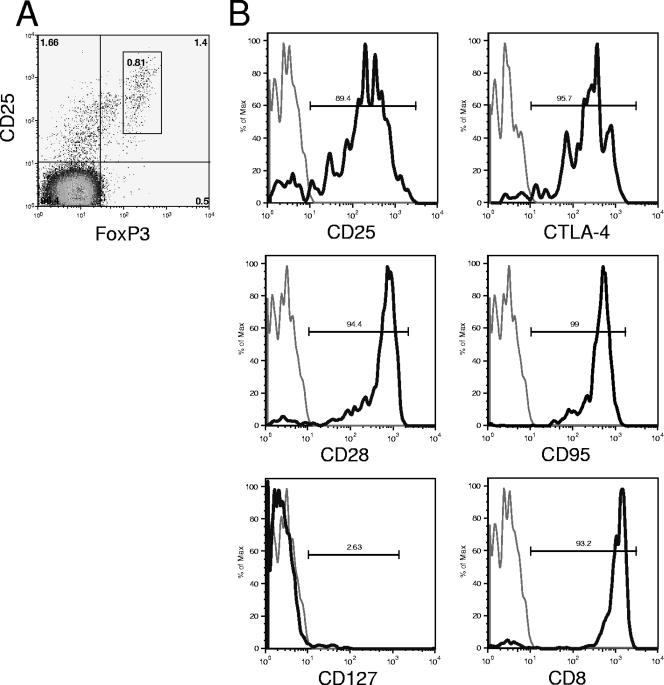
FIG. 5.
Characterization of CD3+ CD8+ FoxP3+ T cells in SIVmac251-infected cynomolgus macaques. (A) Pseudocolor plot showing CD25 and FoxP3 expression on CD3+ CD4− lymphocytes 18 days after infection. (B) Gated CD3+ CD4− FoxP3+ lymphocytes 18 or 190 days after infection. Gray line, isotype control; black line, antibody specific for the indicated marker.

