FIG. 6.
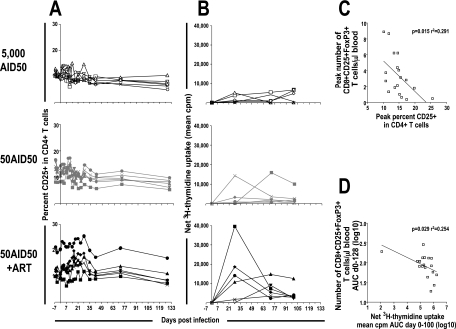
Correlation between CD8+ CD25+ FoxP3+ T cells and immune activation. The proportions of CD3+ CD4+ lymphocytes that were CD25+ (A) and the proliferative response to AT-2-inactivated SIV (B) of individual macaques are shown. (Top) Six cynomolgus macaques inoculated intravenously with 5,000 AID50 (open symbols). (Middle) Six cynomolgus macaques inoculated intravenously with 50 AID50 (gray symbols). (Bottom) Six cynomolgus macaques inoculated intravenously with 50 AID50 and treated (AZT, 3TC, and indinavir) from 4 h postinfection to 28 days postinfection (black symbols). (C and D) Inverse correlation between the peak number of CD8+ CD25+ FoxP3+ T cells and the peak proportion of CD25+ cells among CD4+ T cells during primary infection (P = 0.017 by Spearman correlation; r2 = 0.291). Shown is the inverse correlation between the total numbers of CD8+ CD25+ FoxP3+ T cells during primary infection (days 0 to 128) (C) and the total SIV antigen-specific proliferative response, days 0 to 100, expressed as the area under the curve (AUC) (P = 0.029 by Spearman correlation; r2 = 0.254) (D).

