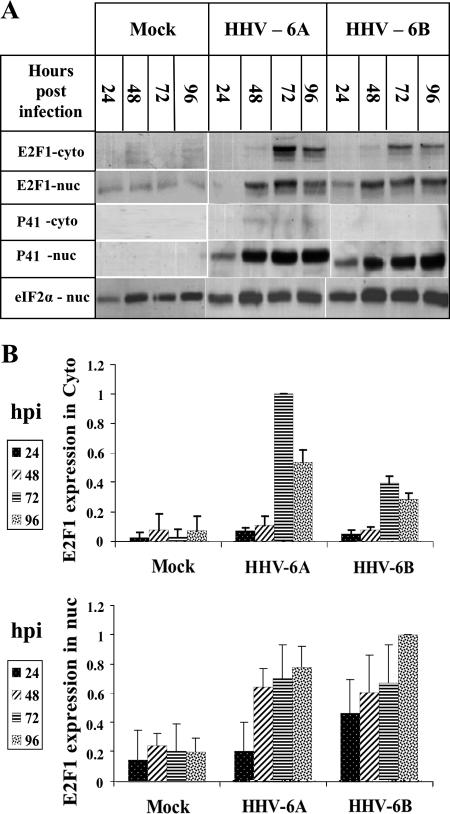
FIG. 3.
Alterations in E2F1 cytoplasmic (cyto) and nuclear (nuc) localization. (A) Recovery of E2F1 and P41 proteins in the cytoplasmic or nuclear fractions. (B) Quantitative representation of the results shown relative to the highest level of E2F1 expression in the cytoplasmic and nuclear fractions. The E2F1-nuc analyses represent averages from four experiments, and the E2F1 cytoplasmic data represented the averages from two experiments. All differences were statistically significant by t tests.

