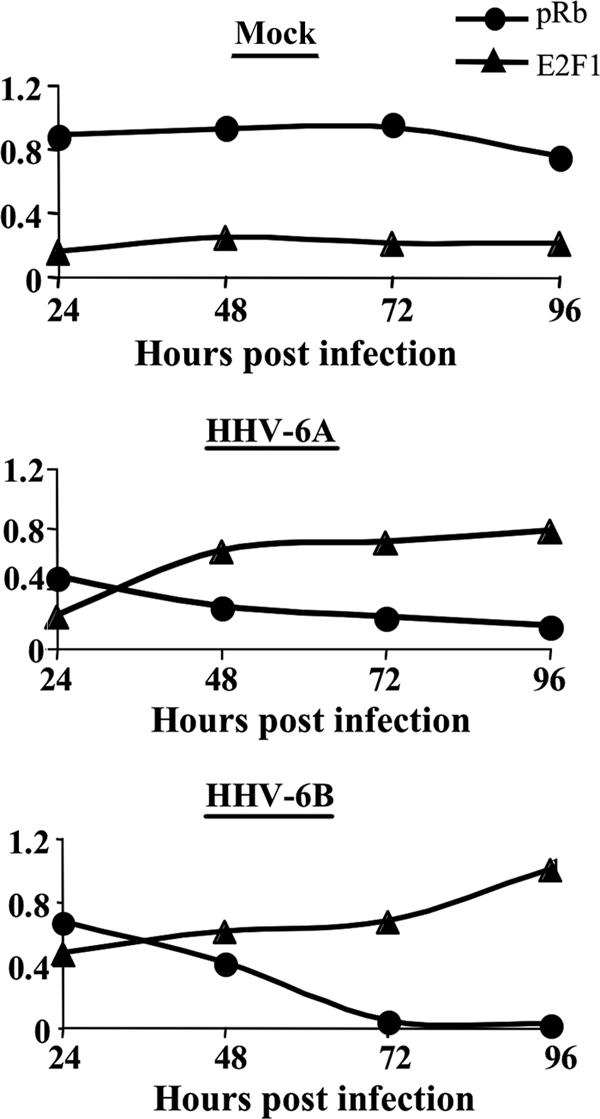
FIG. 5.

Alterations of pRb and E2F1 in mock-infected and virus-infected cells. Graphic representations of E2F1 and pRb in the nuclei of mock-infected and virus-infected cells are shown. pRb and E2F1 values are shown relative to the highest protein level detected: E2F1 in the 96-hpi sample of HHV-6B infections and pRb at 72 hpi in the mock-infected cells.
