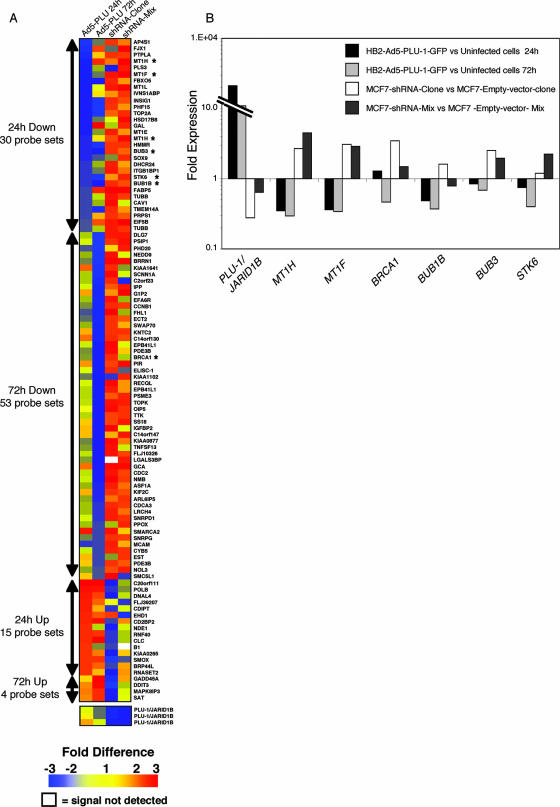
FIG. 2.
Increased or decreased expression of PLU-1/JARID1B in mammary epithelial cells results in changes in the profile of gene expression. (A) TreeView diagram depicting the genes that were significantly deregulated following the manipulation of PLU-1/JARID1B expression. Red represents upregulated genes, blue represents downregulated genes, and yellow represents unchanged expressions. The numbers on the color scheme represent the changes in gene expression. White coloring represents a signal not detected. The columns designated Ad5-PLU 24 h and Ad5-PLU 72 h represent changes in gene expression in Ad5-PLU-1-GFP-infected cells normalized to uninfected cells at 24 and 72 h, respectively. The columns designated shRNA-clone and shRNA-mix represent changes in gene expression in the MCF7-shRNA-clone normalized to the MCF7-empty-vector-clone and in the MCF7-shRNA-mix cells normalized to MCF7-empty-vector-mix cells, respectively. The color values represent the averages between biological replicates. Four biological replicates were used for Ad5-PLU 24 h, three replicates were used for Ad5-PLU 72 h, and two replicates each were used for the shRNA-clone and shRNA-mix. The numbers of the probe sets significantly (P < 0.05, Student's t test) up- or downregulated at 24 and 72 h after infection with Ad5-PLU-1-GFP are shown on the left of the tree. Asterisks denote genes that were further analyzed for their expression with q-RT-PCR. Note that the PLU-1/JARID1B transgene in the adenovirus does not contain the 3′ UTR that is detected by the PLU-1/JARID1B-specific microarray probe set. Therefore, changes in the expression of PLU-1/JARID1B mRNA could be detected only in the RNAi cell lines where endogenous mRNA is silenced. (B) Confirmation by q-RT-PCR of expression changes shown by microarray data. RNA was isolated from HB2 cells 24 and 72 h after infection with the recombinant adenovirus and from the shRNA-MCF7 cells before reverse transcription and q-RT-PCR analysis. Data for each gene are normalized against primers for β-actin and are represented as the change (2-ΔΔCT) compared to the negative control (uninfected HB2 cells or the empty vector transfected MCF7 cells). One representative experiment out of at least two experiments is shown.

