FIG. 5.
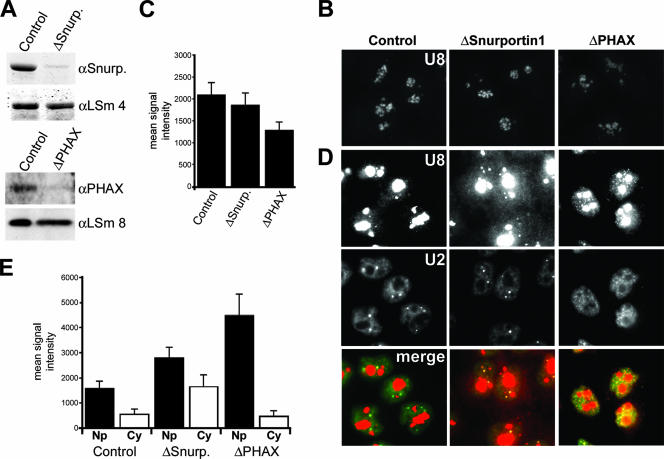
Snurportin1 and PHAX are required for the correct localization of the U8 snoRNA. (A) Western blot analysis of the depletion of Snurportin1 and PHAX. The siRNA duplex used is indicated above each lane. The antibodies used are indicated on the right (αSnurp., anti-Snurportin1). Proteins derived from equal numbers of cells were loaded. GL2 is the control siRNA targeting luciferase. (B and D) Protein requirement for U8 snoRNA localization. Cells were treated with siRNA duplexes targeting Snurportin1 or PHAX or the control siRNA targeting luciferase (GL2). After 60 h of incubation, the cells were hybridized with fluorescent oligonucleotides complementary to the U8 snoRNA (B and D) and the U2 snRNA (D). The same exposure time was used for each fluorescent probe to allow direct comparison of the subcellular distribution of the RNA after the depletion of specific factors. A short exposure of the U8 snoRNA signal from each of the knockdowns is shown in panel B. A longer exposure of the U8 snoRNA signal, needed to visualize nucleoplasmic and cytoplasmic U8 snoRNA signals, is shown in panel D. The protein targeted is indicated at the top. For each set of cells, the top, middle, and bottom rows of panels show the U8 snoRNA, the U2 snRNA, and an overlay of the two individual images, respectively. The mean levels of U8 snoRNA in the nucleolus (C), nucleoplasm (Np) (E), and cytoplasm (Cy) (E) from control and knockdown cells are represented graphically. The data shown for each knockdown represent the averages of levels derived from 25 to 30 cells. When selecting nucleoplasmic regions for quantitation, care was taken to pick areas close to the nuclear membrane and as far away from the nucleolus as possible to avoid the nucleolar signal. The horizontal axis, in each case, denotes the protein targeted. The vertical axis denotes the mean fluorescent intensity.

