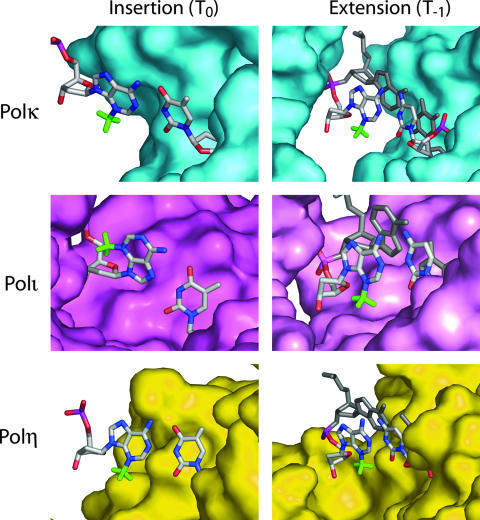
FIG. 4.
Modeling of 3meA in the active sites of Polκ, Polι, and Polη. 3meA was modeled in place of A at the templating base (insertion) or in place of G at the postinsertion template residue (extension) for each polymerase. Surface representations of Polκ (upper panels; PDB accession no. 2OH2), Polι (middle panels; PDB accession no. 2FLL), and Polη (lower panels; PDB accession no. 1JIH) are shown in cyan, magenta, and yellow, respectively. The methyl group of 3meA is shown in green. The DNA from the Polκ structure was modeled into Polη based on the alignment of the Polκ and Polη catalytic residues. The incoming dTTP is shown opposite the 3meA at position T0. For modeling 3meA at the T−1 position, the G residue present in the structures was replaced by 3meA; the original cognate C residue is shown to provide a reference point for the base pair; the next template residue and incoming dTTP are shown in gray. The thumb region of each polymerase was removed to provide a clear view of the active sites.

