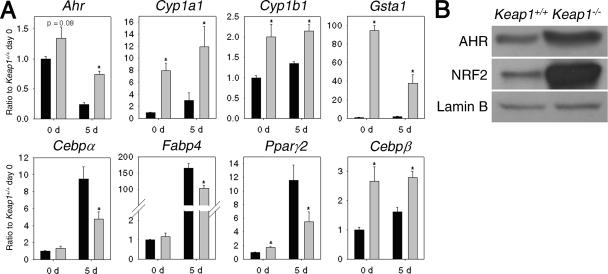
FIG. 5.
Effects of Keap1 genotype on transcript and protein levels in MEFs. (A) Transcript levels of Ahr and downstream genes and markers at day 0 and day 5 after stimulation of adipogenesis in Keap1+/+ MEFs (black bars) and Keap1−/− MEFs (gray bars). Ratios to Keap1+/+ MEFs on day 0 (Ratio to Keap1+/+ day 0) are shown on the y axes. Time after stimulation of adipogenesis (in days [d]) is shown on the x axes. Values are means plus standard errors (error bars) (n = 3). Values that are significantly different (P < 0.05) from that of the respective Keap1+/+ MEFs (*) are indicated. (B) Protein levels of AHR and NRF2 were detected by immunoblotting.

